


Let’s get something out of the way up front.
Tradeshows work. Live events create the kind of connections, conversations, and pipeline moments that no algorithm, email sequence, or LinkedIn outreach campaign has ever reliably replicated. If you’ve been in this industry long enough, you’ve seen the research, and more importantly, you’ve felt it. The deal that started with a handshake on the showfloor, the partnership that came together over a product demo, the customer relationship that deepened because you were both in the same room at the right moment. All are solid examples. That value hasn’t gone anywhere.
What has changed is the price of access to those moments. And if your exhibit budget is still built on 2024 assumptions, you’re in for a reckoning.
The 2025 Annual Survey of Exhibition Rates, produced by The Exhibitor Advocate in partnership with Tradeshow Logic and independently audited by EVOLIO Marketing, benchmarks material handling, labor, booth furnishings, internet access, and other essential services across 224 tradeshows at 23 major U.S. cities. It is the most comprehensive, independently verified look at what exhibiting actually costs in this country. And it makes one thing unmistakably clear: The cost of showing up is rising, it is rising faster than general inflation, and it is coming from forces that are largely outside your control.
That last part matters. Because understanding where cost pressure is coming from, and where it isn’t, is the first step toward doing something smart about it.
What’s Actually Driving Costs Up
The survey data is specific, and specificity is useful. Here’s what moved in 2025:
- Electrical outlet rates jumped 18.4 percent, hitting a national average of $204.91 for a basic 120V/5-amp drop. For context, U.S. inflation for the same period was 2.7 percent. Some of this reflects a continuing industry shift toward bundled pricing, which rolls electrical labor into the outlet rate. It simplifies the ordering process but also makes the total cost less visible until the invoice arrives.
- Material handling base rates rose 9.5 percent to a national average of $2.28 per pound. Since this survey launched in 2022, drayage base rates have climbed 21.3 percent. If you’ve wondered why your freight costs feel like they’ve developed a mind of their own, there’s your answer.
- Booth flooring costs accelerated sharply. Carpet is up 12.7 percent, rebond padding is up 21 percent, visqueen is up 22.1 percent, and vacuuming, the one line item most people don’t think twice about, is up 30 percent. For exhibitors with larger footprints, these aren’t rounding errors. They compound.
- Display labor continued its steady climb, with straight time rates up 6.4 percent to a national average of $157.48 per hour and overtime up 9.2 percent. The U.S. Bureau of Labor Statistics reports union wages rose roughly 5 percent over the same period, so this tracks. Labor costs are a function of negotiated agreements and market conditions. They are what they are.
None of these increases are a function of your exhibit company charging more for the same services. They are venue-driven, contractor-driven, and market-driven. They are the cost of simply showing up, not the cost of how you show up.
The Geography of It All
If cost pressure were uniform across the country, at least the math would be consistent. It isn’t.
The survey’s basket-of-goods analysis, a standardized comparison of 14 common exhibition services, finds that exhibiting in New York now costs over 75 percent more than in Atlanta. New York’s basket totals $3,531. Atlanta’s is $2,012. Philadelphia ($3,512) and San Francisco ($3,249) round out the most expensive markets, while Las Vegas ($2,112), Houston ($2,225), and Nashville ($2,256) represent the more affordable end of the spectrum.
For anyone managing a multi-show calendar that spans both coasts, this isn’t a footnote. It’s a planning variable of the highest magnitude. The cost difference between showing up in Philadelphia versus Las Vegas, for essentially the same footprint and services, is not trivial. Knowing that number before you finalize your show schedule is the difference between strategic planning and expensive improvisation.
There’s also a rare bit of good news in the data: hanging sign and lift rates dropped an average of 15.3 percent, the largest single-category decline in the survey’s history, driven by a shift away from blended pricing in several major markets. And secondary material handling rates fell 15.4 percent. These aren’t transformative, but they’re real, and they’re worth knowing when you’re estimating costs.
What the Data Says About Exhibitor Behavior
Here’s the part that’s worth sitting with. According to companion research from The Exhibitor Advocate’s 2025 Evolving Landscape of Event Marketing study, 75 percent of exhibitors rate the overall value of their event programs as excellent or good, a figure that actually rose eight points in a single year. Despite everything from cost escalations and budget pressures to the side-eye from finance when you submit your invoices, exhibitors still believe in what tradeshows deliver. The value proposition of live events is intact. The challenge isn’t belief. It’s math.
With 62 percent of event budgets consumed by non-revenue-generating expenses like booth space, show services, and shipping, the resources available for the activities that actually move the needle get compressed. Eighty percent of exhibitors cite cost management as their top challenge. And half say rising costs threaten to outweigh the value they receive from participating.
The response to that tension, increasingly, isn’t to stop exhibiting. It’s to exhibit differently. Smarter. More intentionally. More selectively. Exhibitors are right-sizing footprints, reducing ancillary spending, and getting sharper about which shows warrant increased investments and which do not. They’re measuring their spend against specific outcomes: cost per lead, cost per qualified contact, and KPIs that matter. And they’re making decisions accordingly.
That is not a crisis. That is a maturing industry getting more sophisticated about how it allocates resources.
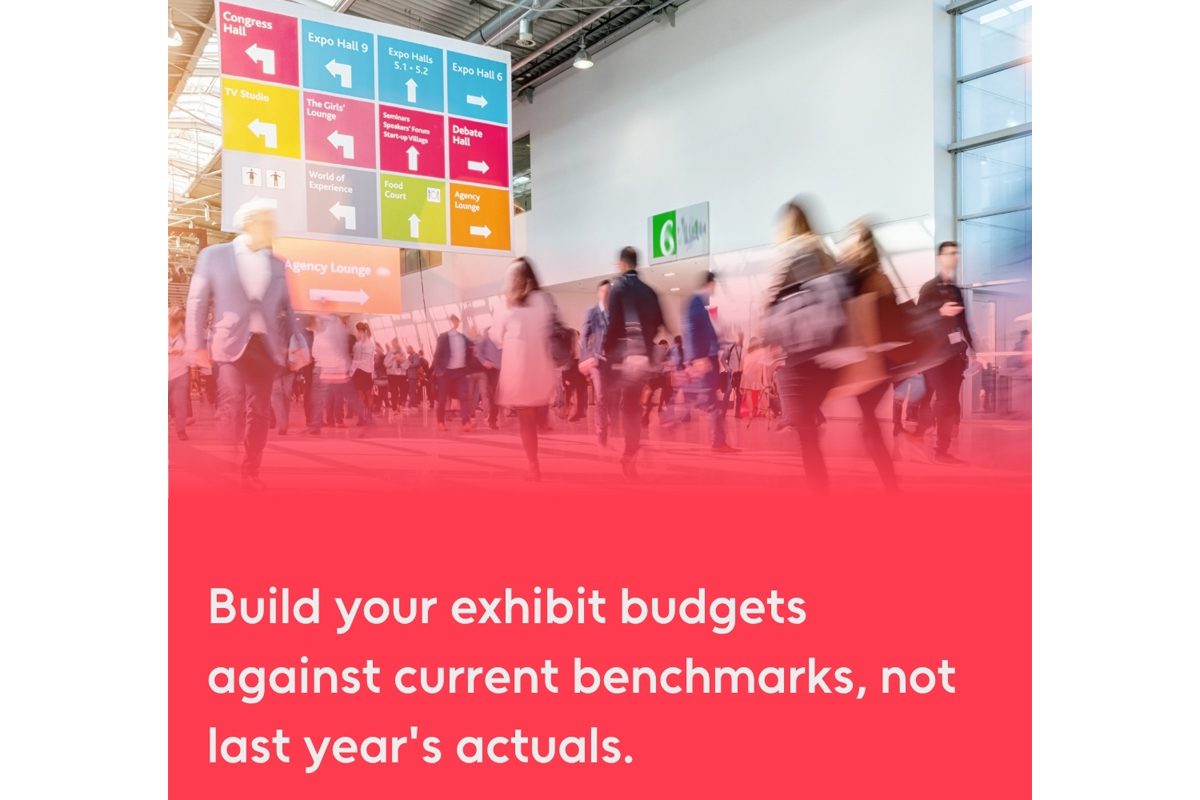
The Real Takeaway: Data, Strategy, and Realistic Budgets
If there’s a single thing this survey should prompt you to do, it’s this: Build your exhibit budgets against current benchmarks, not last year’s actuals.
The 2025 Annual Survey of Exhibition Rates gives you the clearest available picture of what services cost in the cities where your shows actually happen. Use it. Know what a realistic material handling estimate looks like for a Chicago show versus a Nashville show. Understand what to expect from electrical rates in Boston versus Miami. Build your plan before you commit to the booth space, not after you receive the exhibitor manual. And never forget to think of your exhibit-marketing program as a cumulative, annual investment rather than a series of standalone spends.
Beyond budgeting, this data reinforces something that the best exhibit marketers already understand: Strategy has to come before spend. The question isn’t just “how much will this show cost?” It’s “what does success at this show look like, how will we measure it, and what KPIs will justify the investment at current market rates?” Those are answerable questions. But only if you’re asking them honestly.
The cost of showing up is going up. That’s a reality none of us can control. What we do control is how prepared we are, how clearly we define what we’re trying to achieve, and how rigorously we measure whether we got there.
Tradeshows still work. Those handshakes are still irreplaceable. And showing up still matters. But showing up smarter, more prepared, and as strategic as possible matters even more.
Data in this article is sourced from the 2025 Annual Survey of Exhibition Rates, produced by The Exhibitor Advocate in partnership with Tradeshow Logic and independently audited by EVOLIO Marketing. The survey benchmarks material handling, labor, booth furnishings, internet access, and other essential services across 224 tradeshows and events at 23 major U.S. cities.
Related stories
The Experiential Design Authority Announces Student Design Awards Finalists
The Experiential Design Authority Announces its 2026/2027 U.S. Advisory Board