



A new benchmark from Exposure Analytics suggests exhibition performance may be better measured by what visitors do after they arrive than by footfall, or the number of people passing through a space.
The company’s 2026 Physical Engagement Index draws on measurements from more than 3,000 events and 43.8 million visitors across 18 countries and 18 sectors since 2020. According to the study, 15.6 million of those visitors engaged with a measured physical space, producing an overall engagement rate of 35.59 percent and average engaged dwell time of 13 minutes, 50 seconds.
For the exhibition industry, however, the more relevant benchmark comes from the report’s exhibition-specific data.
Exhibitions hold attention longer
According to the study, Exposure Analytics measured 9.6 million visitors in exhibition environments. Those spaces recorded a 39.7 percent engagement rate, with engaged visitors staying an average of 16 minutes, 54 seconds.
By comparison, activations recorded a 34.8 percent engagement rate and average dwell time of 9 minutes, 46 seconds. Retail environments produced a higher 54.8 percent engagement rate, although that category represents a much smaller sample of 130,000 visitors.
The report defines an exhibition as a trade or industry environment where organizations exhibit to an audience, such as a tradeshow or congress.
The gap between stopping and passing by
The broader dataset also shows a wide difference between the highest- and lowest-performing physical spaces.
The top 10 percent of measured spaces by engagement converted 76.3 percent of visitors into engagement, according to the study. The bottom 10 percent recorded a 3.9 percent engagement rate.
Dwell time showed another substantial gap. Spaces in the top 10 percent for dwell held engaged visitors for an average of 33 minutes, 31 seconds. The bottom 10 percent averaged 3 minutes, 52 seconds.
Exposure Analytics argues that those differences illustrate a limitation of relying on footfall alone. Two spaces can attract similar traffic while producing very different levels of visitor interaction.
Does booth location tell the whole story?
The report also raises questions about one of the exhibition industry’s longstanding assumptions: that the highest-traffic locations necessarily produce the strongest engagement.
Front-center locations in the dataset recorded a 41.6 percent engagement rate and average dwell time of 12 minutes, 2 seconds. Front-left locations recorded a 49.9 percent engagement rate and 16 minutes, 51 seconds of dwell, while front-right locations reached 45 percent engagement and 16 minutes, 31 seconds.
However, the sample sizes vary considerably. Front-center locations accounted for 12.2 million measured visitors, compared with 109,000 for front-left and 129,000 for front-right locations. As a result, the findings provide a point for comparison rather than proof that one booth position consistently outperforms another.
North America leads regional engagement
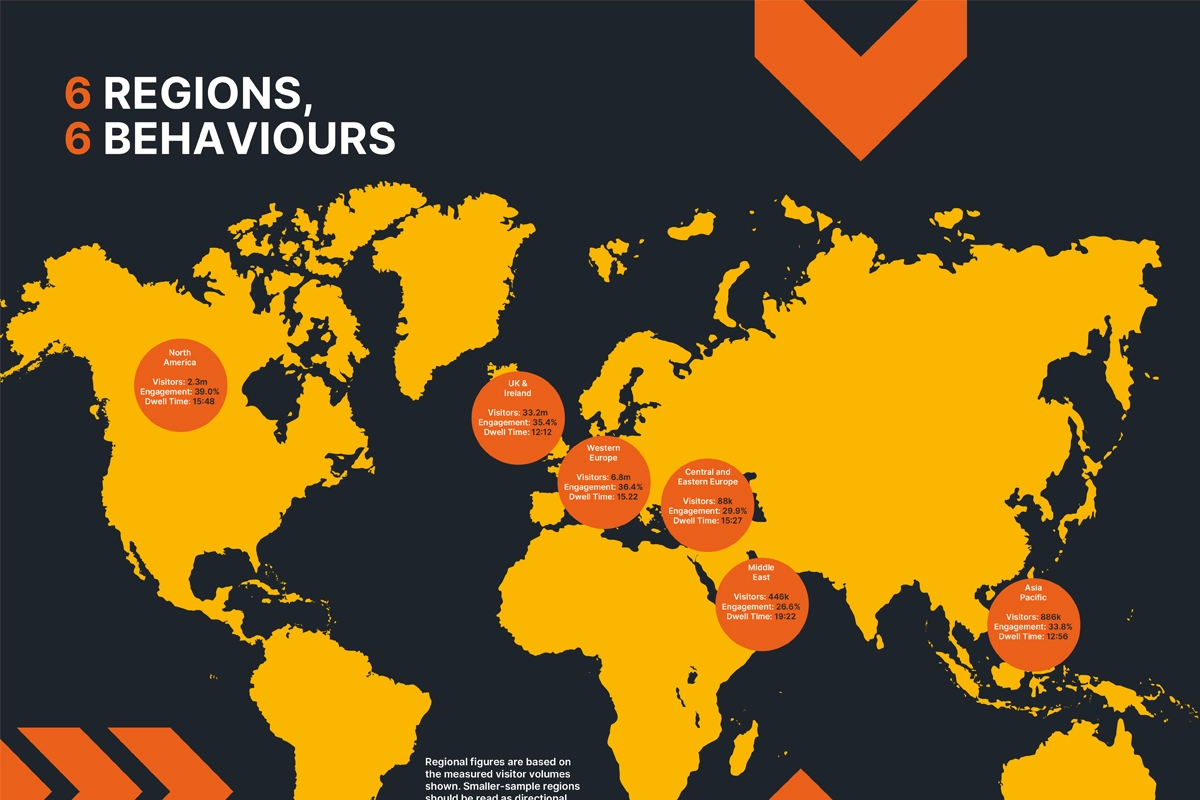
North America posted the highest regional engagement rate in the study at 39 percent, with average dwell time of 15 minutes, 48 seconds. The North American sample included 2.3 million measured visitors.
However, the dataset is heavily weighted toward the United Kingdom and Ireland. That region accounts for 33.2 million measured visitors, more than three-quarters of the global sample. The report acknowledges that smaller regional samples should be viewed as directional rather than definitive benchmarks.
A benchmark with limits
Exposure Analytics measures total visitors, engaged visitors, and dwell time through sensors deployed across exhibition halls, activations, retail environments, and other physical spaces.
According to the report’s methodology, engagement occurs when a visitor remains within a specified distance of a sensor for a minimum period. However, clients determine both the distance and time parameters. The company excluded test deployments, calibration runs, internal research and development, and duplicate records from the benchmark.
The dataset covers 2020 through April 2026. Exposure Analytics also cautions that measurements from 2020 and 2021 came from fewer events because of pandemic restrictions, while data from 2022 onward carries greater statistical weight.
For exhibitors and organizers, the report does not eliminate traditional attendance or footfall measurements. Instead, its findings suggest another question belongs alongside them: once visitors arrive, how many stop, and how long do they stay?
Exposure Analytics measures visitor behavior in physical spaces for brands, agencies, event organizers, and venue operators. The company publishes the Physical Engagement Index as an annual benchmark.
Report provided by Exposure Analytics. Edited and reported by Exhibit City News for clarity, context, and style.
Related stories
North America Leads 2026 Physical Engagement Benchmark for Exhibitions